[Updated January 2024]
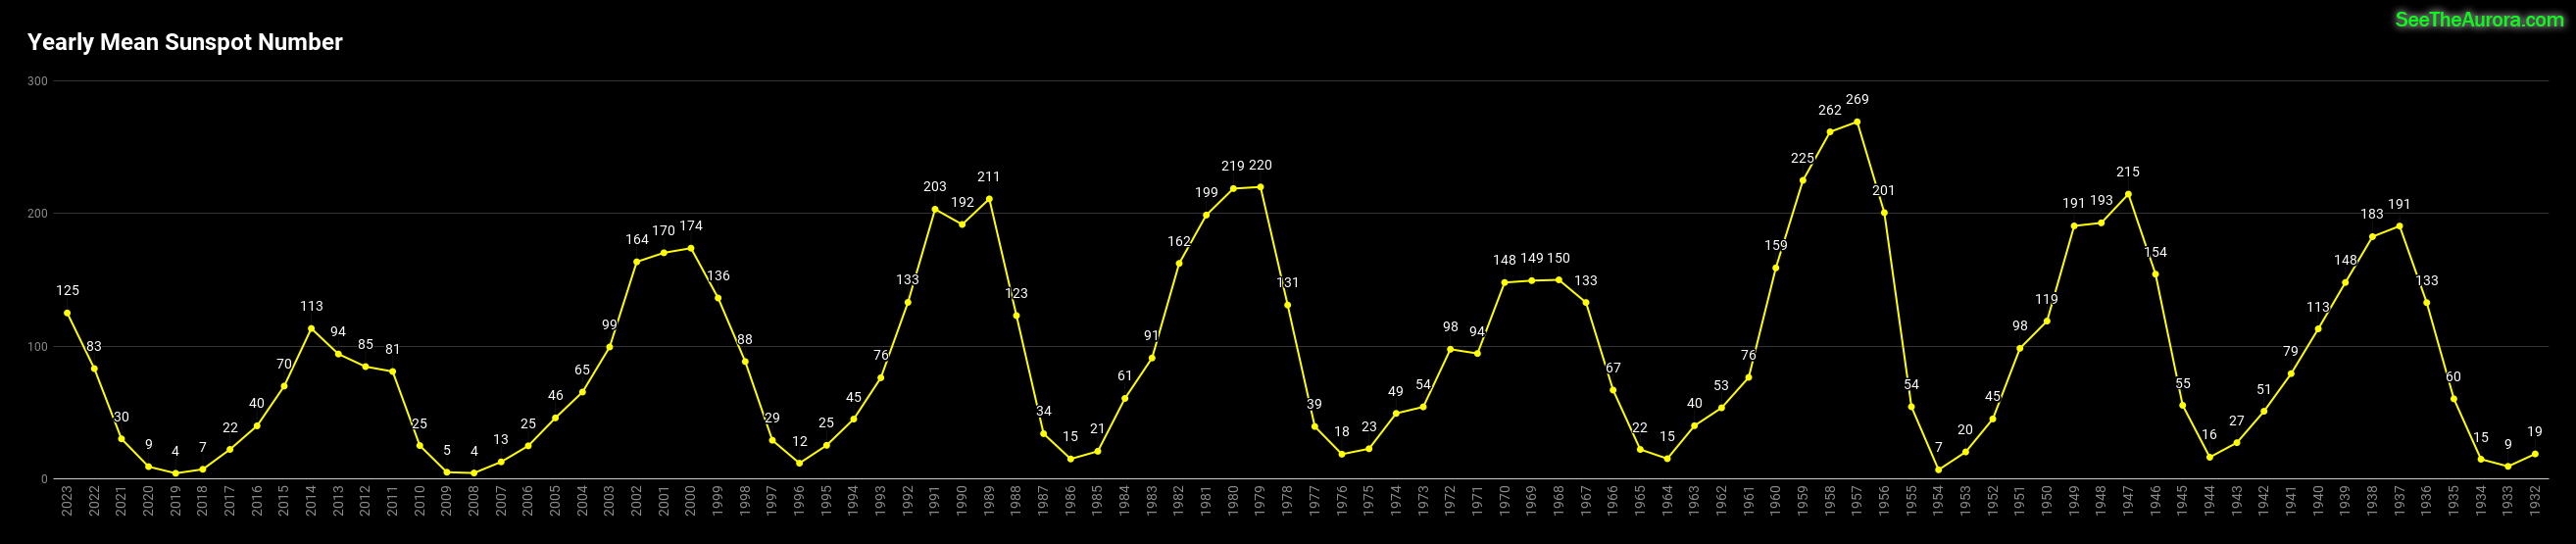
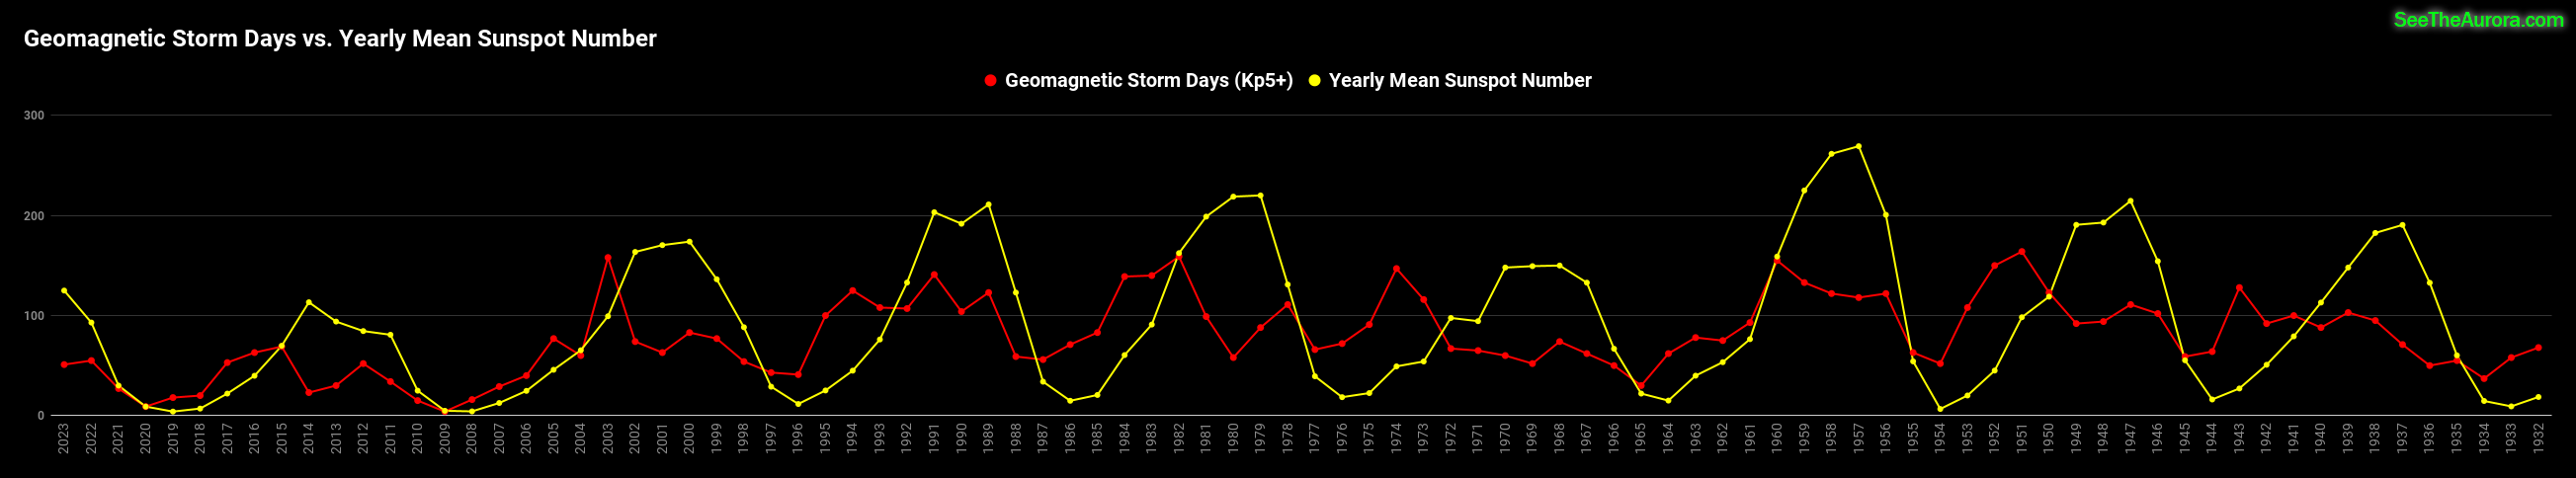
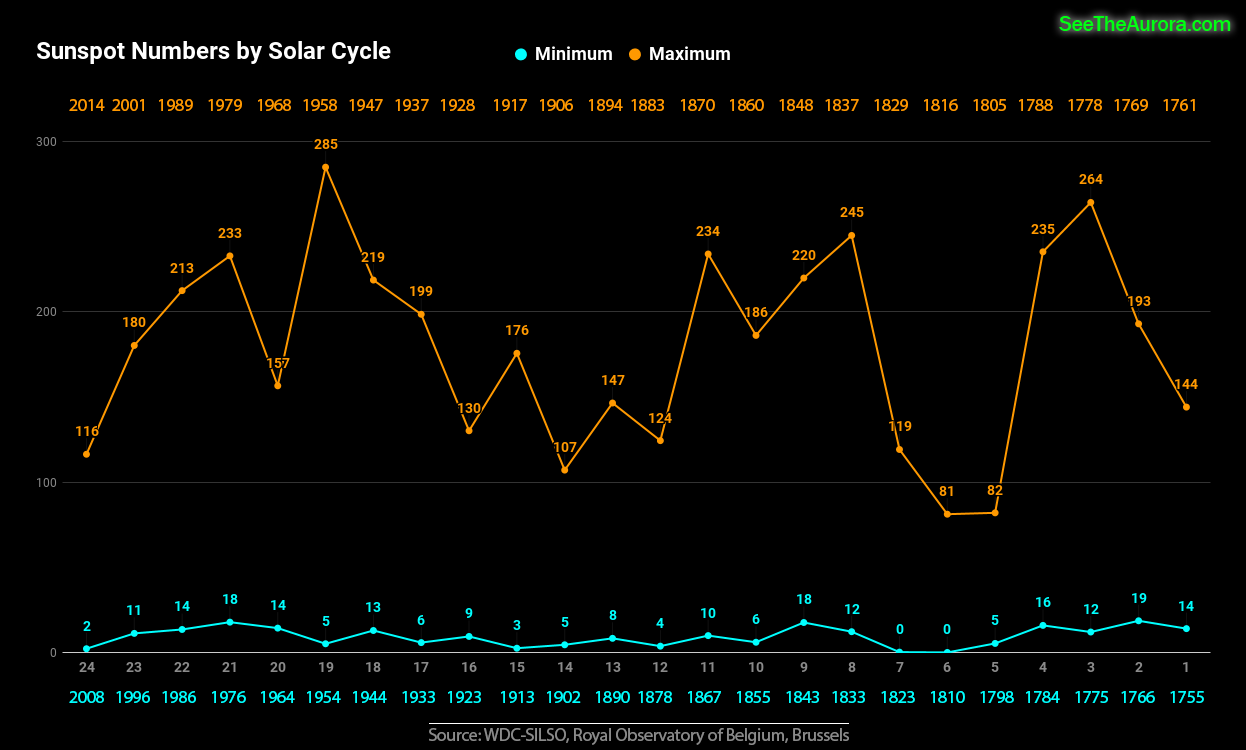
Climatologists study records of Earth’s weather to calculate averages and find trends and patterns.I wanted to do the same with space weather to find out how geomagnetic activity varies by year, month, and day. The British Geological Survey (BGS) has been keeping records of geomagnetic activity since 1932. So I imported this 92 years worth of data into a spreadsheet to analyze it, and break it down into graphs and charts. The Royal Observatory of Belgium – SILSO has been recording sunspot numbers for even longer since the 1700’s. The effects of the solar cycle become clear in the first 6 graphs below.
What is the Solar Cycle?
For centuries it has been known that the sun follows a regular pattern of high and low solar activity. This period averages 11 years in length, but can vary from 9 to 13 years long. Solar maximum is defined as the month with the highest sunspot number. Conversely, solar minimum is defined as the month with the lowest sunspot number. Learn how the sunspot number is counted here. Once solar minimum is reached, that marks the end of one solar cycle and the beginning of the next. As of 2024, we are nearing the maximum of solar cycle 25, which started in December of 2019. The previous solar cycle (24) was the weakest in 100 years. The strongest solar cycle (19) on record occurred in 1957.
Visit the Kp Index Explained page to learn how it relates to seeing the aurora.
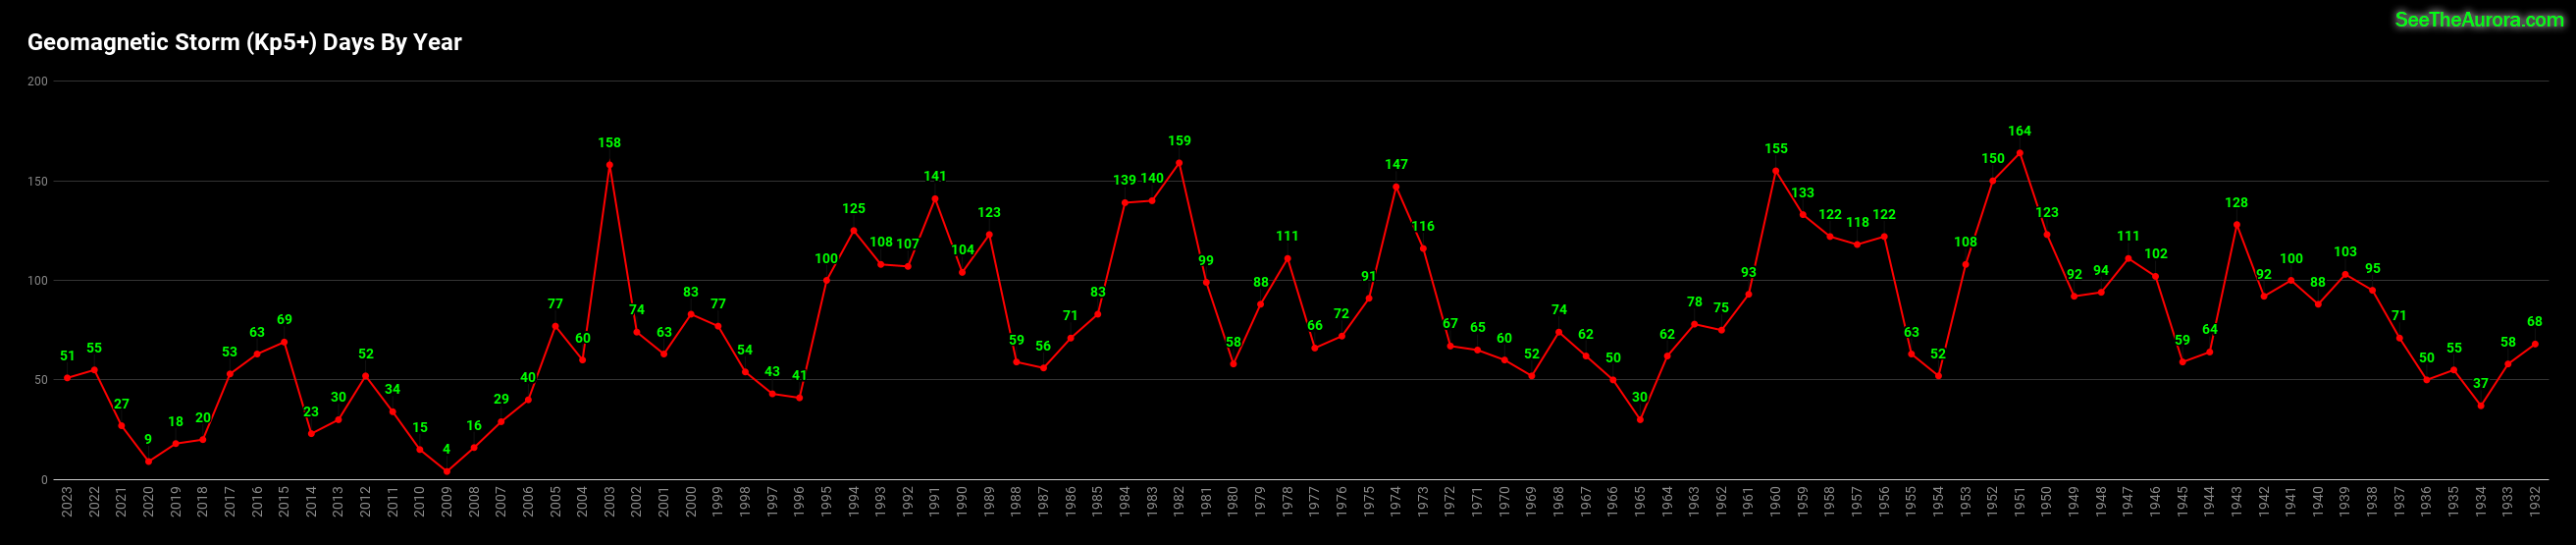
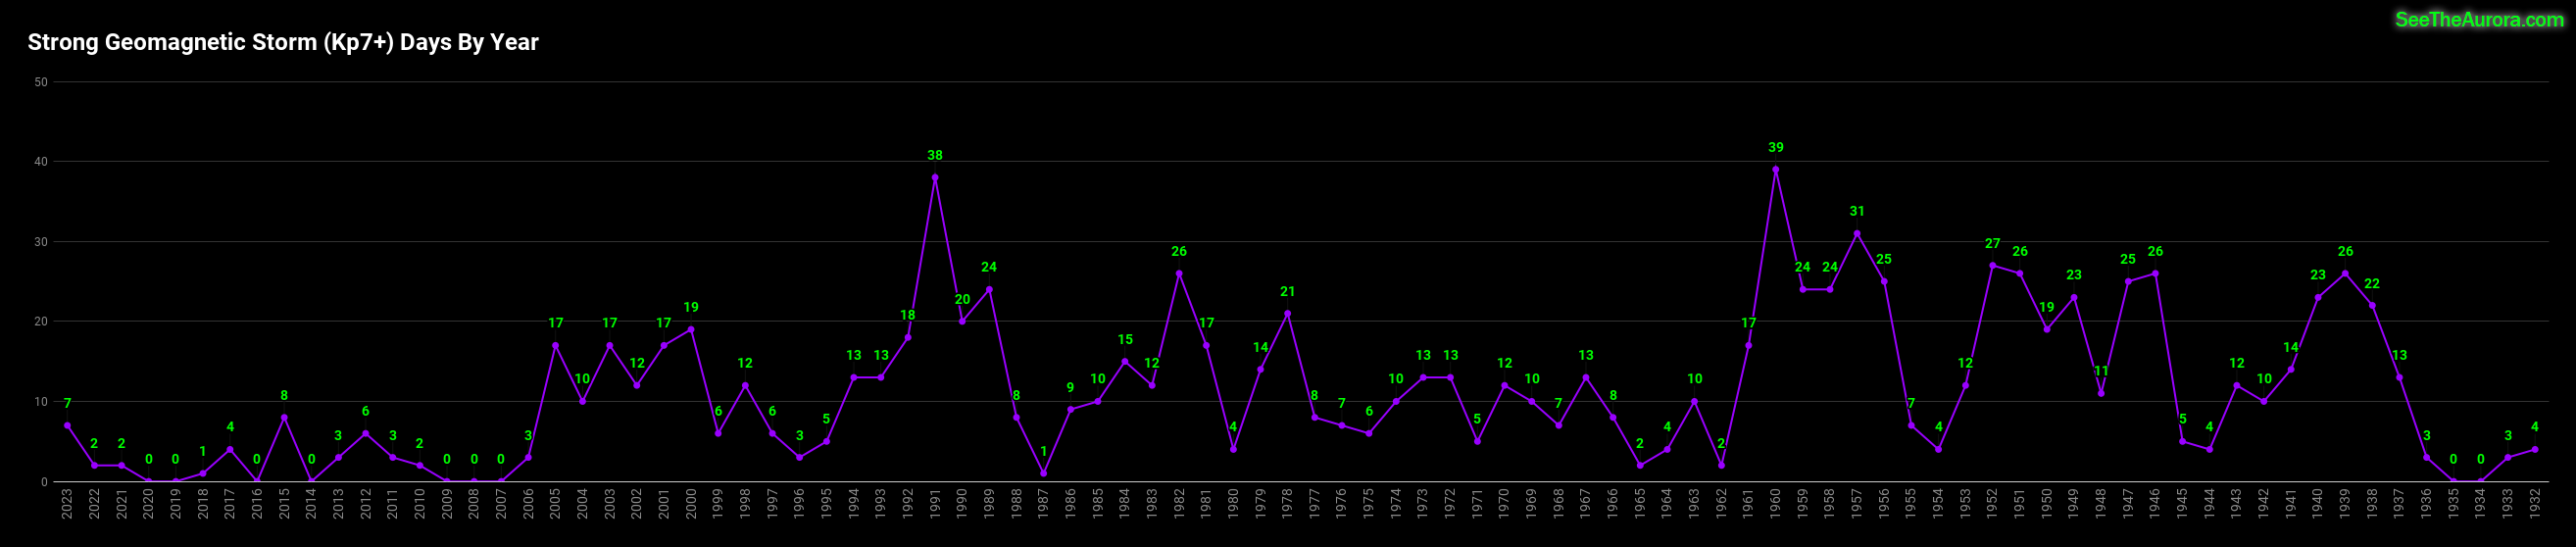
By Year
After looking at this data, a few things become apparent:
- Starting in 2006 solar activity has dropped off dramatically. Since 2006 there have been only 41 strong (KP7) geomagnetic storms. The previous 18-year period had 258. In addition the years 1932 – 2005 had 82 extreme (KP 9) geomagnetic storms. But since 2006 there have been zero.
- The years of greatest geomagnetic activity do not coincide with solar maximum. Instead they occur 3 years afterward on average. The years of lowest geomagnetic activity almost always occur 1 year after solar minimum.
- The last truly active year was in 2003. According to this map the northern lights would have been visible from the latitudes of Calgary, the Minnesota-Canada border, and southern Scandinavia on an average night. From locations like Vancouver, Minneapolis, Montreal, northern UK, and southern New Zealand the aurora would have appeared 1 out 3 nights on average (not considering weather).
- There are plenty of anomalies. The sun isn’t always predictable. Some solar cycles have double peaks, and some years are more or less active than might be expected.
By Month
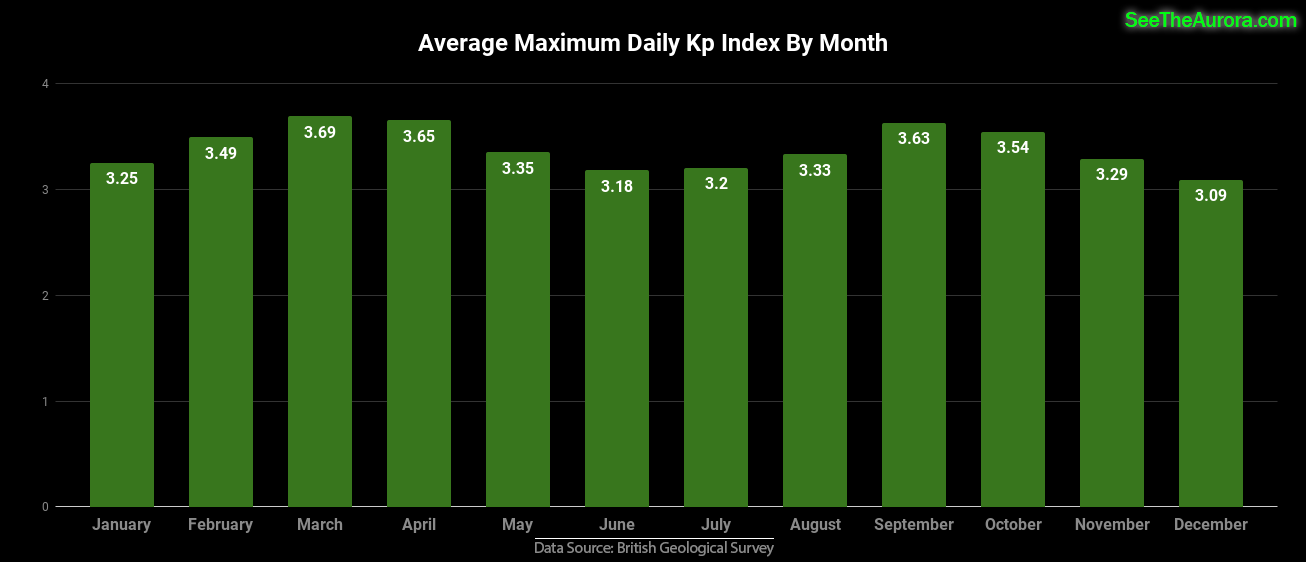
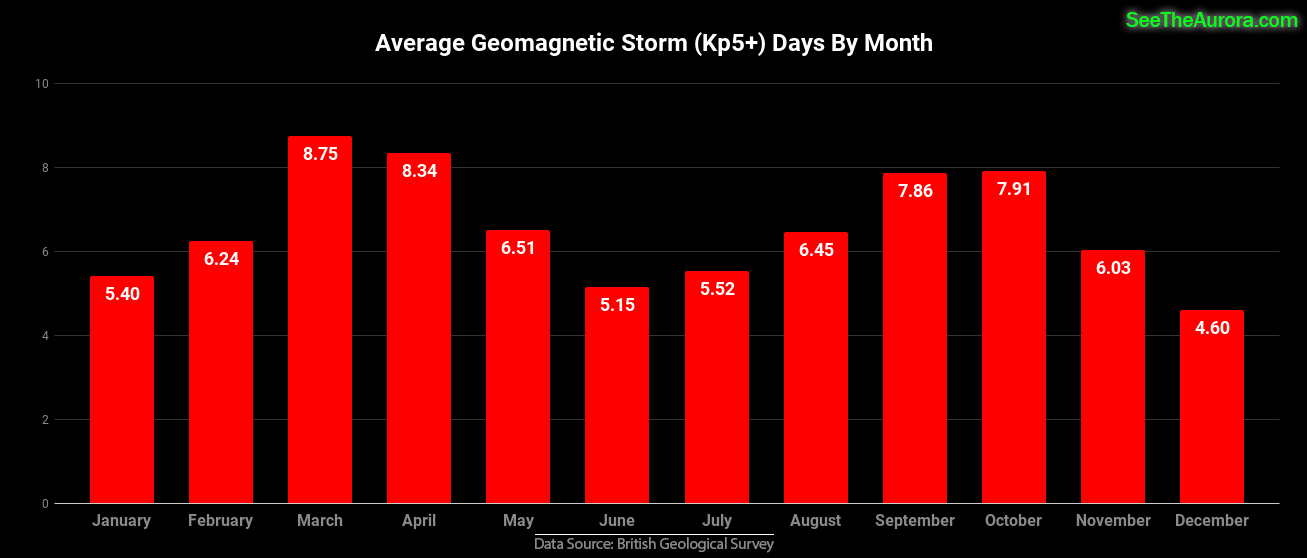
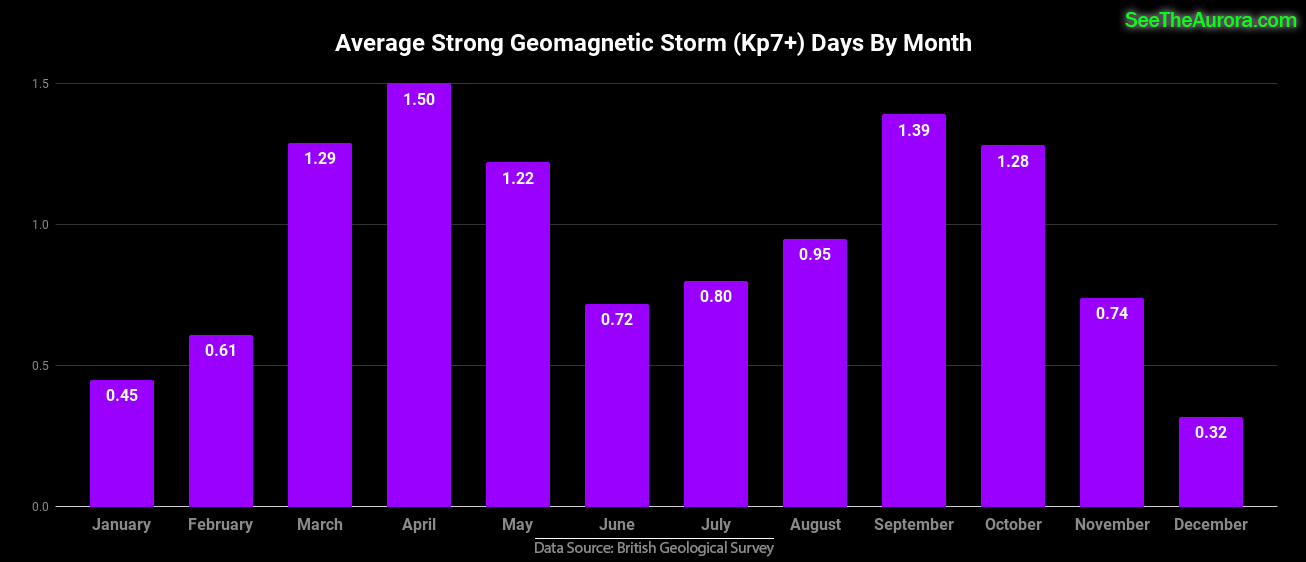
The numbers above will obviously vary depending on the solar cycle. But still, it’s clear that geomagnetic storms are more common during the spring and fall months than they are in summer and winter. For instance a strong geomagnetic storm of Kp7 or above is almost 5x more likely to occur in April compared to December. The reason for this likely has to do with Earth’s tilt. During the equinoxes, Earth’s axis is 0° relative to the ecliptic, and the sun’s magnetic field lines can better connect with Earth’s magnetic field. But during the solstices the Earth is tilted 23.4° which makes it harder for their magnetic fields to link up.
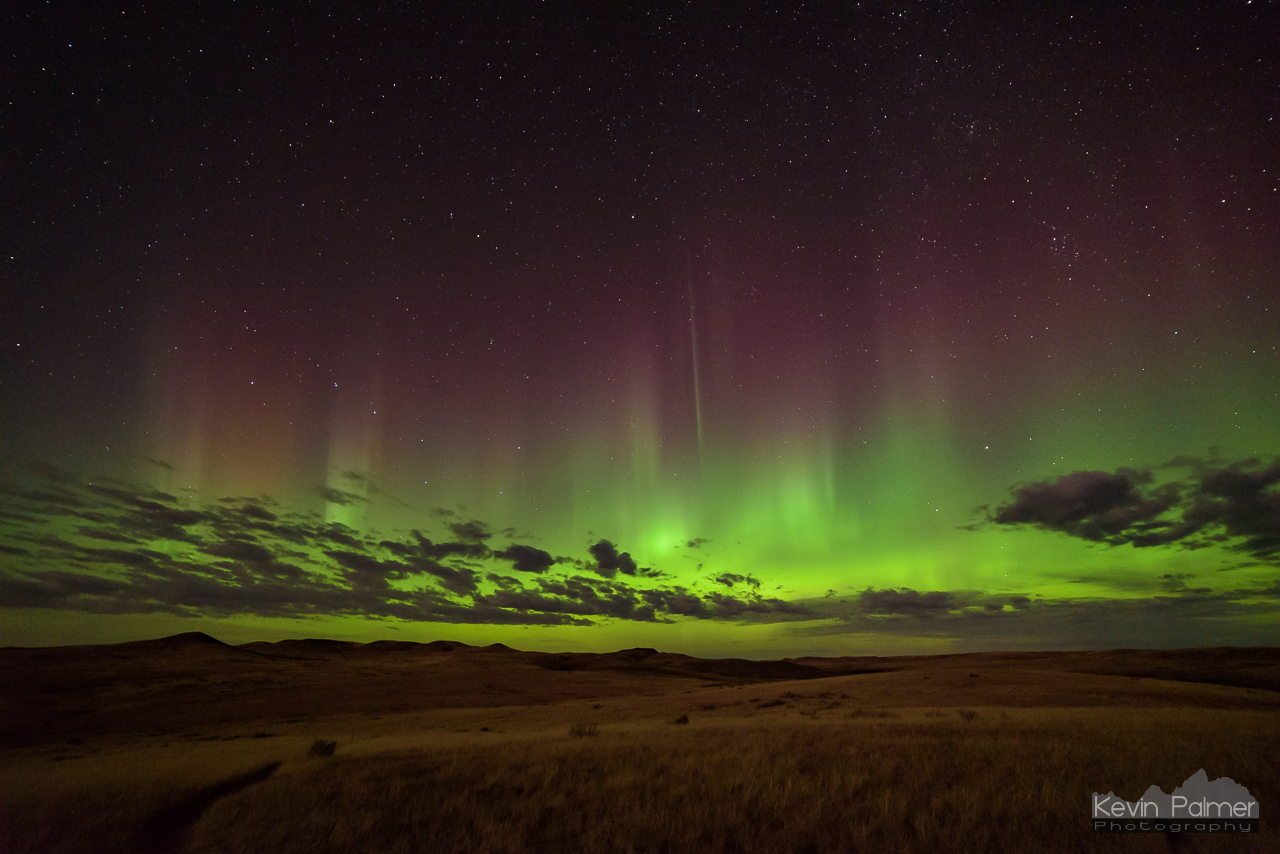
This seasonal variation matches my personal experience as well while aurora hunting. My aurora sightings have been very sparse in December, January, and June. September is my favorite month to see the aurora with March being a distant second place. But the climate and amount of clouds plays a big part in success rates as well.
Most Active Month On Record
March of 1989 had an average daily Kp index of 5.51. There were geomagnetic storms on 21 days. This includes an extreme solar storm on March 13th which caused a widespread power outage in Quebec.
Least Active Month On Record
December of 2009 had an average daily Kp index of just 1.05. There were 11 days in which the Kp index never rose above 0. During this time the northern lights would have been almost non-existent unless you were directly underneath the auroral oval.
By Day
Most Geomagnetically Active Days of the Year
Date…………………………Average Kp Index
- April 4………………….4.10
- September 27………4.01
- March 1……………….3.94
- April 1………………….3.94
- September 26………3.94
- May 2………………….3.93
- March 23…………….3.93
- April 3…………………3.92
- March 28…………….3.91
- March 30…………….3.91
Least Geomagnetically Active Days of the Year
Date…………………………Average Kp Index
- June 21……………….2.77
- December 6…………2.82
- December 7…………2.84
- June 22……………….2.89
- December 8…………2.92
- July 2………………….2.95
- June 20……………….2.95
- December 12……….2.95
- May 19………………..2.96
- July 7………………….2.98
On April 4, there is a 37% chance of a geomagnetic storm occurring. On June 21st, there is only a 13% chance. But don’t read too much into exact dates. One of the best aurora displays I’ve ever seen happened to occur on one of the least active days historically.
If you are planning a trip to see the aurora hopefully this data will help you decide when to go and have the highest success rate. Of course there are other factors to consider as well such as climate and length of day/night.